

 Facebook
 X
X
 Pinterest
 Copy Link
June Swoon? The Headline vs. The Underlying Data
Last month I described a market that had gone quiet, a standoff where neither buyers nor sellers seemed to want to move first, and said the back half of the year hinged on whether summer would shake either side loose. June gave us an answer, but it is a genuinely split one. The headline is spectacular. The underlying demand data is not. Here’s the link to the data:
June Swoon?
There’s an old saying that summer brings a June swoon. By the headline numbers, there was no swoon at all. But the leading indicators, the ones that tell us where the market is heading rather than where it has been, are pointing the other way. You need both halves to understand this market.
Single Family Homes (Page 1)
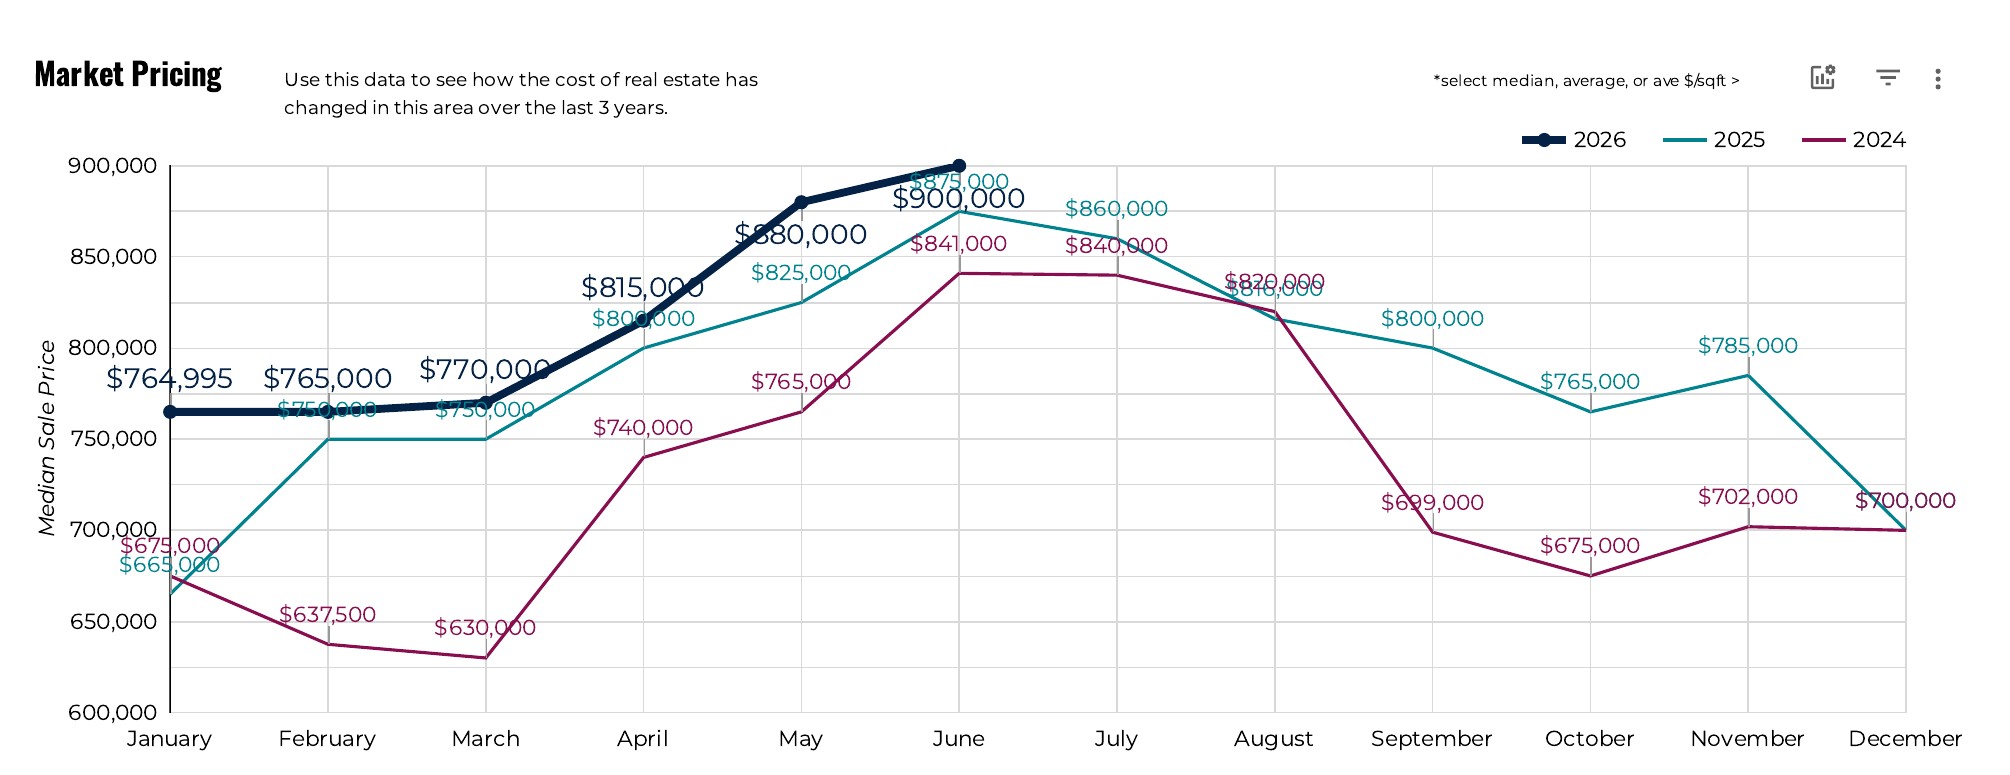
On paper, single family homes had a blockbuster month. 763 homes closed (up 9.8%) and total volume crossed $1.04 billion, up a remarkable 22.3% year-over-year. I’ll say it again, because even as a veteran of this market who should not be surprised anymore, I still find it shocking: Fairfield County single family homes traded more than a billion dollars in a single month. Prices climbed too, with the median at $900,000 (up 2.9%) and the average at $1,363,161 (up 11.4%). That gap matters: the heavy activity is at the top, where $2M to $2.99M sales rose 22.8% and $3M+ sales rose 27.7%.
But here’s the other side (Page 3). New listings rose 5.2% to 914, yet new pendings, the best read on fresh buyer demand, slipped 5.1% to 669. June’s record closings are the spring’s contracts finishing, a lagging indicator, not proof that demand is accelerating now. Inventory is still extraordinarily tight at 1.52 months of supply, so this remains a seller’s market and buyers still paid 5.3% over asking. But the pace of new buyers is easing, and days on market rose from 10 last June to 17.
Condos (Page 4)
Condos tell a softer story. 224 closed (down 4.3%) and the median actually slipped to $445,000 (down 1.1%), the first negative median in a while. Condo buyers paid just 1.6% over asking, basically asking price, versus 5.3% for single family. The real headline is the supply and demand split (Page 6): new listings jumped 24.0% while new pendings fell 22.0%. More condos are hitting the market just as fewer buyers step up.
Much of this may be driven by the continued struggles of HOAs to keep their books balanced. There’s been an uptick in mortgages denied on the basis of a complex’s financials. When you pair that with rising HOA fees and special assessments, you can see why the average buyer might sour on a condo as their next home.
What Does it Mean?
Buyers: For single family homes, especially above $1M, the competition is still real, over-ask offers are everywhere, and the best homes move fast… so be prepared and decisive. But softening pendings mean you have a little more leverage than the headline volume suggests. Condo buyers have it better: more listings, fewer competitors, prices at or near asking. This is the most negotiating room you’ve had in a while.
Sellers: Single family sellers are in a strong window, especially in the upper price ranges. Price it right, present it well, and expect real interest. Condo sellers should be more measured: with listings up 24% and pendings down 22%, price at market, don’t count on an over-ask premium, and expect it to take a few weeks.
Looking Ahead
New pendings have now softened year-over-year for a third straight month, and condo supply is building fast. If that continues, the back half of the year cools off, first in condos and then more broadly, even with inventory this tight. If buyers re-engage over the summer, June’s strength carries forward. Either way, don’t let one record month distract from the leading indicators. They’re the part of the report that tells you what’s coming.
As always, reach out with any questions, I’m happy to chat!


