

 Facebook
 X
X
 Pinterest
 Copy Link
What Does It All Mean? |
|
This month, I’m trying something new with my Market Report. Rather than providing the data and my general analysis of what’s happening, I’m going to try to use the platform to provide some general answers to questions I often get. I’ll show you how I look at the data and derive these answers, so you’ll know how to check in on the data in future months to see if the same answers would apply. If you have a question that you’d like answered in a subsequent Market Report, please reach out and let me know! |
|
Closing out August, I find myself fascinated by how different the first half of the year was compared to the second (so far). Looking at Median Single Family Home (SFH) Sales Prices (top right of Page 2), we can see that 2025 EXPLODED up to a $750k Median Sales price in February (that’s over$200,000 more than February 2023!!). That immediate jump had a lot of talking heads calling for 2025 to be another leap forward in home prices… but you can see that each month since, we’ve lost ground against the previous two years. |
|
Now the Median SFH Sales Price of August 2025 comes in at $825k – a modest $43k more than August 2023, and a mere $5,000 (you read that right!) more than 2024. Comparing the last 4 months of 2024 to 2023, you can see that the market was essentially flat (leading many of those same prognosticators to declare the boom market in Fairfield County OVER at the end of last year)… Barring changes to mortgage interest rates, I’m expecting similar market behavior for the last 1/3 of 2025. |
|
In August, we sold ~1% fewer Single Family Homes than we did in 2024… but we sold them for ~6% more on average. Year to date we’ve sold about 1.9% more than last year for about 6.6% more, so you can work out the pace of the slow-down. |
|
Figuring out the cause of the slowdown is a bit more of a mystery: August had 592 New Listings for SFHs (middle of Page 2), which is a 5% reduction from August 2024. I would tend to say that our reduction in units sold is being driven by an inventory crunch… but just under that chart is the New Pendings chart, and that’s down 13% (!!) over last year. Even though there are fewer SFHs to buy, buyers are being even more selective with their offers. I am confident there are buyers out in the market because the Days On Market is still in the 20s, and not in the 50s or 60s as would indicate a derth. |
|
What’s Hot? |
|
One of the first data points I check each month is the price category (both for Single Family Homes at the bottom of Page 2 and Condos at the bottom of Page 3) that is seeing the most (and least) amount of demand. You can see that Single Family Homes between $1.1M and $1.39M are seeing quite the buyer interest right now. |
|
If I were a builder trying to decide what price point to target with my new builds (all of this being predicated on the appropriate neighborhoods, obviously), that’s what I’d be targeting for my list price. Buyers are quite active (29 Days on Market) and are wiling to bid competitively (7.9% Average Over Asking!). On top of all of that, inventory for this group is down 20% from last year – all in all, very good indicators for this price category being a healthy target for builders. Big caveat here: all real estate is local, so figuring out what price point to target with a lot you already own is NOT this simple – give me a call and we can discuss! |
|
On the other end of the spectrum, if I’m a first time home buyer looking for a bargain… I’m probably looking for a condo under $299k, as there’s the least amount of competition with other buyers (only 1% over asking on average). My goal would be to own an housing/investment vehicle that helps me build equity so that I could buy in a more competitive (read: desireable) market in a few years. |
|
What is a better investment: Condos vs Single Family Homes? |
| This is a very tough question to answer without knowing additional specifics about the buyer, but I did come across a very interesting data point that I want to share with you: |
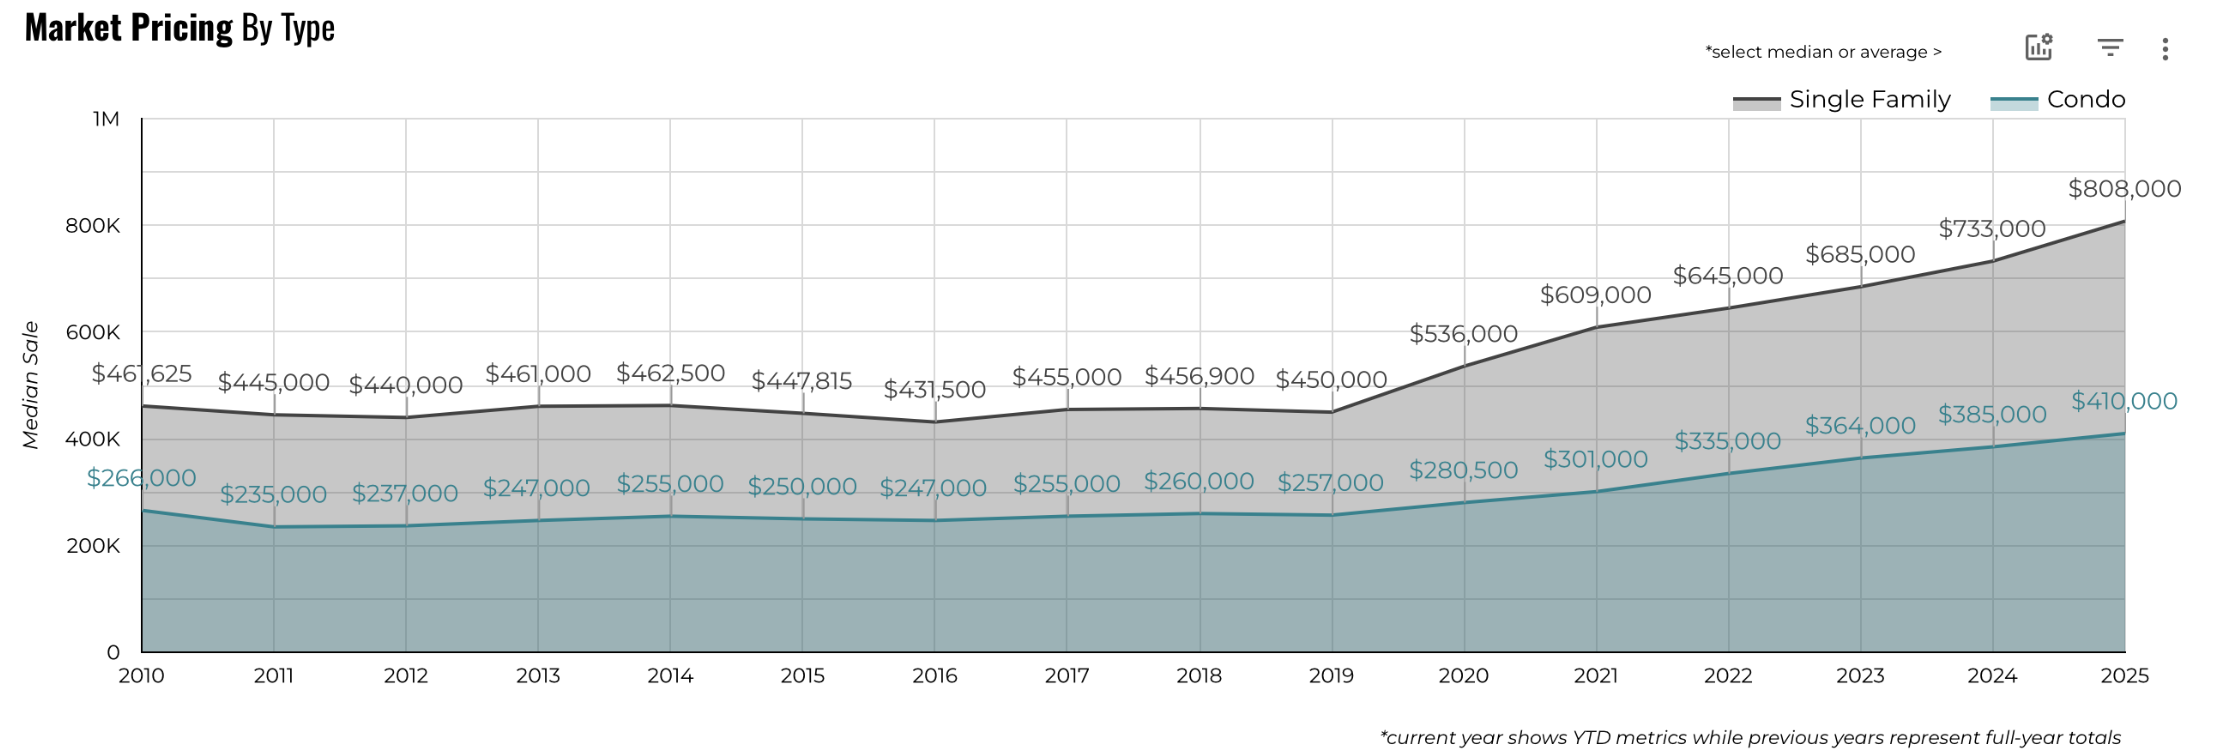 Median Value of Single Family Homes vs Condos over Time
|
|
For the longest time, median Condo prices tracked very well with Median SFH prices in Fairfield County. While the SFH prices were always higher, median Condo values were generally ~55% median Single Family Home values. COVID caused a descernable shift in that relationship: the median Condo price is now barely above 50% of the median SFH price. Condo owners have enjoyed much of the pandemic equity gains… but they are losing out to their single family home owning peers. |
|
While it is absolutely true that many first time home buyers can’t really participate in the Single Family Home market (and that is becoming a larger and larger issue), it’s also true that buying a Condo to gain equity doesn’t automatically solve that problem. Additional strategies are needed to find ways to break into SFH ownership – reach out and we can put together a plan. |
|
As always, I look forward to connecting! |
Market Report •
October 9, 2025
August 2025 Market Report


